
Charles University, 1st Faculty of Medicine
Albertov 4, 12801 Praha 2, Czech Republic - tel.: +420 224 968 001, e-mail: lge @ lf1.cuni.cz
Albertov 4, 12801 Praha 2, Czech Republic - tel.: +420 224 968 001, e-mail: lge @ lf1.cuni.cz
Education
Science and Research
Microscopy Center
Project of Excellence
Congress ICCB2016
Norwegian Grant
Publications
Equipment
EMBO Workshop
Gallery
Contacts
Job Advertisement
Software
Back to CSCB

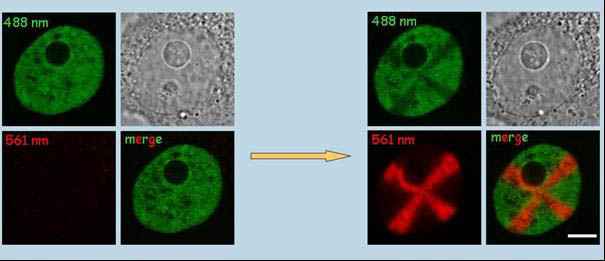
HepG2H4-Dendra2 stable cell line. Non-activated H4-Dendra2 (left) exhibits green fluorescence (excitation at 488 nm). Photoconversion of H4-Dendra2 in a cross-shaped region results in bright red fluorescence (excitation at 561 nm, left) and partial bleaching of the green fluorescence (right). The two channels (green and red), phase contrast and merged signals are shown. Bar, 1µm. (Cvackova et al., J Struct Biol. 2009;165:107-17)
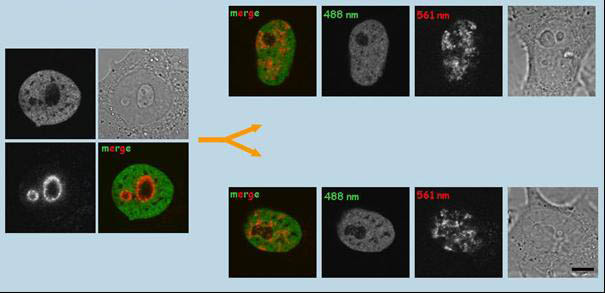
Photoconversion of histone H4-Dendra2 in the nucleolus-associated chromatin region (NAC) of HepG2H4-Dendra2 cells and distribution of the labeled chromatin signal in daughter cells. Histone H4 is relatively stable in the nucleosomes, and thus represents a good marker for long-term observations. The chromatin closest to the nucleoli in H4-Dendra2-expressing HepG2 cells was photoconverted in S/early G2 phase. Labeled cells were observed by time-lapse imaging. Initial snapshots taken just after photoconversion and snapshots taken 14h later are shown (each panel contains the red and green channels, the brightfield image). It was demonstrated that, compared to the mother cell, the distribution of the photoconverted chromatin is significantly different in daughter cells. Bars, 1µm (Cvackova et al., J Struct Biol. 2009;165:107-17)
Cold-dependent detection of the nuclear epitope epiC. Methanol-fixed human fibroblast cells (LEP) were incubated with mouse anti-actin monoclonal antibody for 2h at room temperature followed by incubation with Cy3-conjugated goat anti-mouse antibodies for 40 min at room temperature (panel A). After several washes, the cells were incubated again with anti-actin antibody overnight at 4C, followed by incubation with Alexa Fluor488-conjugated goat anti-mouse antibodies for 60 min (green channel; B). The merged image is shown in panel C (red:staining at room temperature, green:staining at 4C). The nuclear epiC epitope was shown to correspond to a dual histone H4 post-translational modification. Bar, 50µm. (Fidlerova et al., J Cell Biochem. 2005; 94:899-916 and Fidlerová et al., J Struct Biol. 2009, 167:76-82)
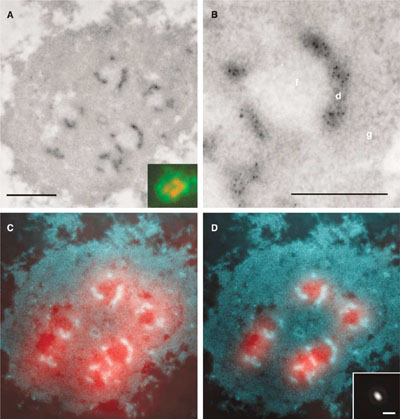
Mapping of ribosomal gene transcription in the nucleoli of human cells. . rRNA is the only known RNA synthesized in the nucleoli. Mapping of the nascent pre-rRNA was done after labeling with 5-bromo-UTP through a combination of electron and fluorescence microscopy. The bromouridine molecules that were incorporated in nascent transcripts were detected with an anti-Br antibody followed by a colloidal gold-conjugated antibody (black dots in A, B; light areas in C, D where the contrast of electron micrographs has been inverted). Gold particles were localized exclusively in dense fibrillar components. Fluorescent secondary antibodies were also used on the same sections (red areas in C, D, and insert in A) Due to the limited resolution, the raw light microscopy image (C) did not allow precise localization of the signal to one of the nuclear compartments. By knowing the point spread function of the microscope (insert in D), it is possible to mathematically improve the resolution of fluorescence microscopy (D, compare with C). The result of this procedure, called deconvolution, indicates that fibrillar centers are the sites of rDNA transcription whereas electron microscopy rightly locates the sites of transcription in the dense fibrillar component (D). Bar 0.5µm (A), 0.2µm (B), 1µm (insert in D). (Malinsky et al., J Struct Biol. 2002;140:227-31, and Koberna et al., J Cell Biol. 2002;157:743-8)
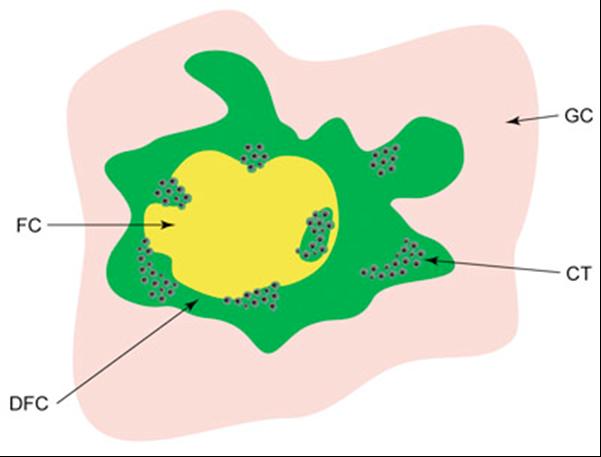
Model for the organization of transcriptionally active ribosomal genes. A schematic picture of the localization of nascent pre-RNA in the nucleolus of a mammalian cell. Different nucleolar compartments are depicted in different colors. Clusters of black dots (CT) represent individual active genes in the form of "Christmas trees". FC - fibrillar centers, DFC-dense fibrillar components, GC-granular components. (Raska et al., Biol Cell. 2004;96:579-94)
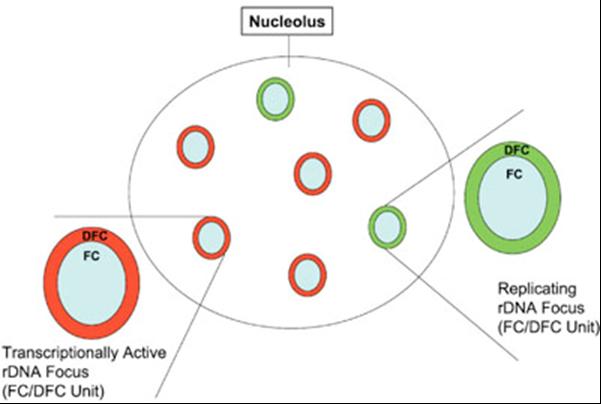
Diagram of the functional "on" and "off" switching of the ribosomal genes. Transcriptionally active ribosomal genes are concentrated in the dense fibrillar components (DFC) of the nucleolus. During S phase, the genes are gradually replicated in such a way that all genes surrounding one fibrillar center (FC) are always replicated simultaneously. The whole area surrounding a single FC is thus either being replicated (green) or transcribed (red). (Pliss et al., J Cell Biochem. 2005; 94:554-65)
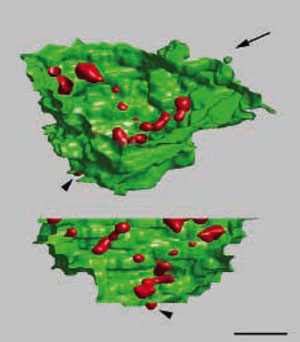
3D localization of nucleolar transcription. Three-dimensional images of rDNA transcription (labeled via incorporation of bromo-uridine, red) in the nucleolus (YOYO-1, green) of an HeLa cell, reconstructed from 26 consecutive ultrathin sections. Two different views of the 3D image are presented. The angle of the view presented in the lower image is indicated by the arrow. Bar, 1 µm. (Koberna et al., J Cell Biol. 2002;157:743-8)
Rate of DNA replication. Newly-synthesized DNA was labeled in living cells with derivatives of deoxythymidine (chloro- and iodo-deoxyuridine). After cell lysis and preparation of DNA spreads, newly-synthesized segments of DNA were identified and the speed of the replication fork was measured. Bars, 5 µm. (Malinsky et al., J Cell Sci. 2001; 114:747-50)
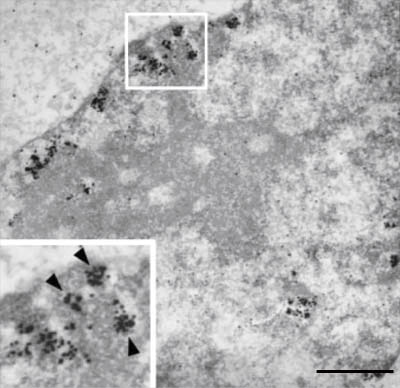
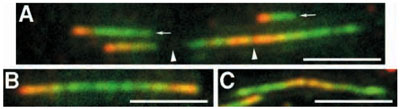
Ultrastructural localization of DNA replication. Newly-synthesized DNA was labeled in mid-S phase by biotin-dUTP, a derivative of deoxythymidine triphosphate. The label was then visualized immunocytochemically with silver-intensified nano-colloidal gold (black dots). Separate clusters of replication foci are clearly seen, as are larger areas of labeling (insert) made up of individual foci (arrowheads). Bar, 1µm. (Koberna et al., J Cell Biochem. 2005; 94:126-38)
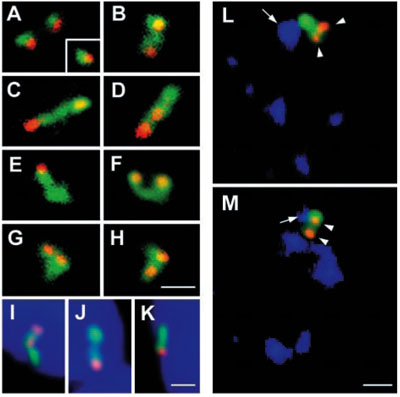
Mapping the transcription of single genes. Spatial relationship between the genes (red) and their transcripts (green), exemplified by EBV (Epstein-Barr virus) DNA. In a small proportion of cells the transcripts remained at the site of transcription (A). In most cases (B-H), the transcribed RNA was seen to extend further away from the gene, likely representing the genes in which transcription has resumed. This movement of the pre-RNA was not directed towards the nuclear lamina (I-K, nucleus is stained in blue), but rather towards SC35-containing nuclear speckles (blue in L, M). Bars, 1.5 µm. (Melcak et al., Mol Biol Cell. 2000;11:497-510)
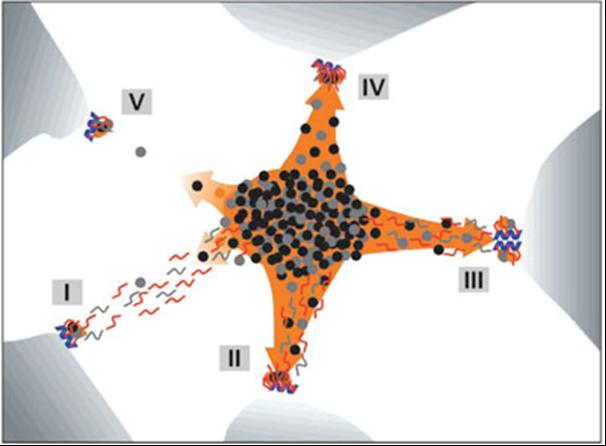
Explanatory sketch of the patterns for genes, transcripts, and splicing factors. . Blue helices - genes; red and gray segments - RNA; black, gray, and orange dots - splicing factors; orange area - speckle; orange arrows - recruitment of splicing factors; concentrated dots in the center with an overall ellipsoidal shape – IGC (interchromatin granule cluster); dots and gray segments outside of the IGC - PFs. Blue, red, and orange correspond to fluorescence images; electron microscropy image is in grayscale. (I) Transcription is moderate (or even high) and co-transcriptional splicing is at a low or moderate level. The recruitment of splicing factors is relatively low; much of the unprocessed pre-mRNA is trafficking to the IGC. RNA trafficking clearly prevails over recruitment of splicing factors, and the RNA tracks that are detected are associated with reservoirs of splicing factors. (II) An example similar to the previous one, but here co-transcriptional splicing prevails. There is increased recruitment of splicing factors and (most of) the RNA tracks that are seen merge into nuclear speckles. Hence, the corresponding gene becomes associated with the speckle. (III) An example of high local transcriptional activity (depicted here at the clustered genes) and both co- and post-transcriptional splicing. The splicing factors are recruited efficiently, and both the RNA and the genes are extensively engulfed in the speckle. This example is similar to II. (IV) Example of a highly transcribed gene, efficient recruitment of splicing factors, and co-transcriptional splicing only. Both the RNA (shown as a spot) and the gene are associated with the speckle. (V) Example of an endogenous gene expressed at a low level. Transcription is low, as is the recruitment of splicing factors. Labeled RNA appears as a spot at the site of transcription, due to relatively elevated local RNA accumulation, and any directed movement of the RNA after its release from the site of transcription is below the level of detection. (Melcak et al., Mol Biol Cell. 2000;11:497-510)
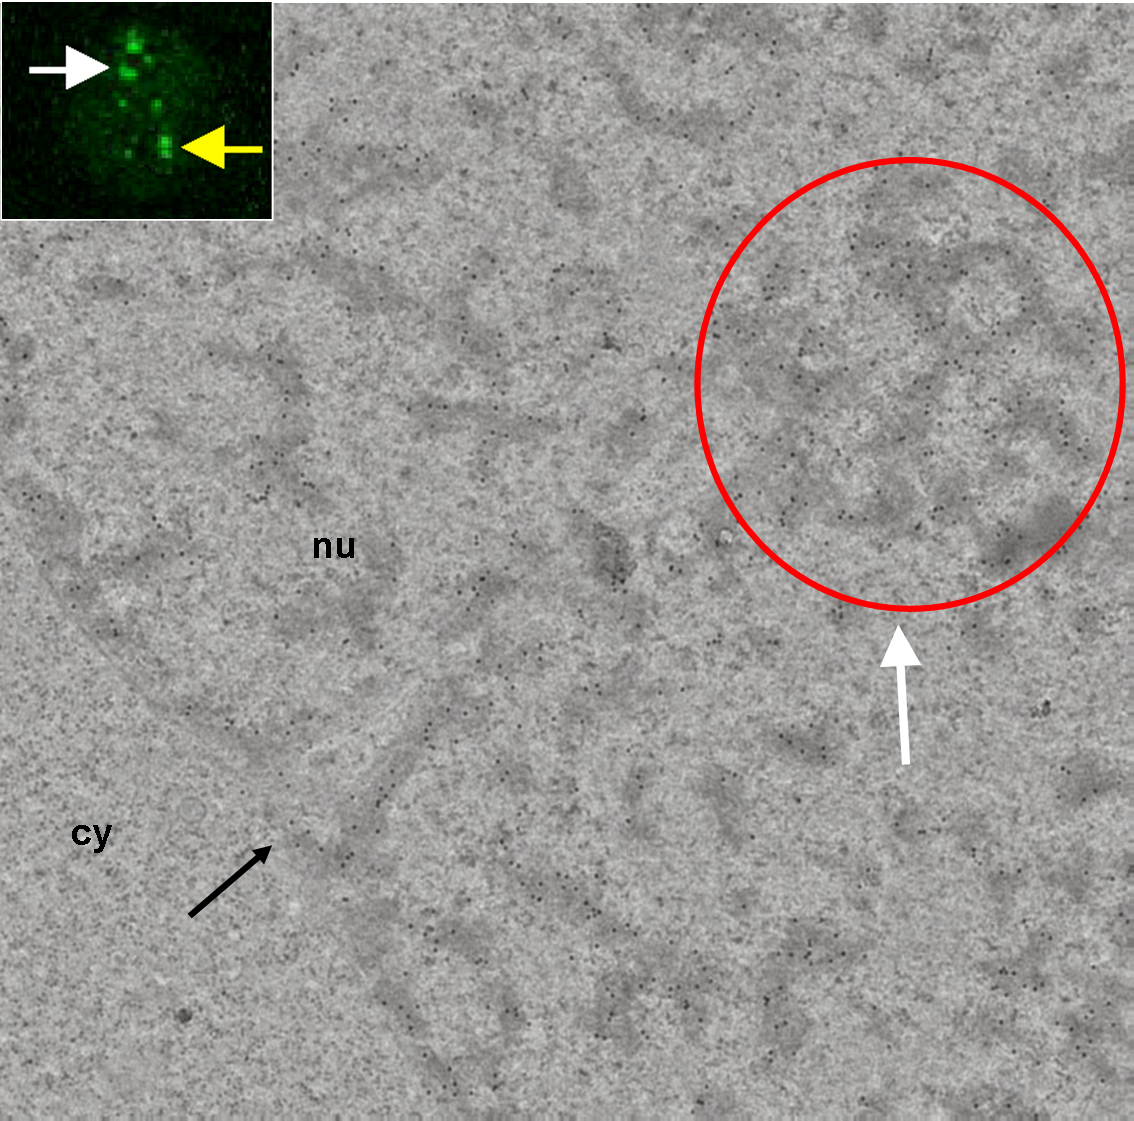
Correlative light-electron microscopy of the PcG (Polycomb group proteins) body. In fluorescence image, the white and yellow arrows point to a nuclear region/domain corresponding to the two GFP PcG bodies. At the electron microscopy level, the white arrow points to a nuclear domain that correlates with (a section of) the PcG body fluorescence (white arrow) and with the local accumulation of heterochromatin structures in this domain (red circle). The electron-dense heterochromatin structures are specifically enriched in the BMI1 immunogold label. We never observed a nuclear domain with a locally increased immunogold label present outside of the heterochromatin structures. However, the densities of gold particles confined to heterochromatin structures outside and inside the "PcG body" were comparable.
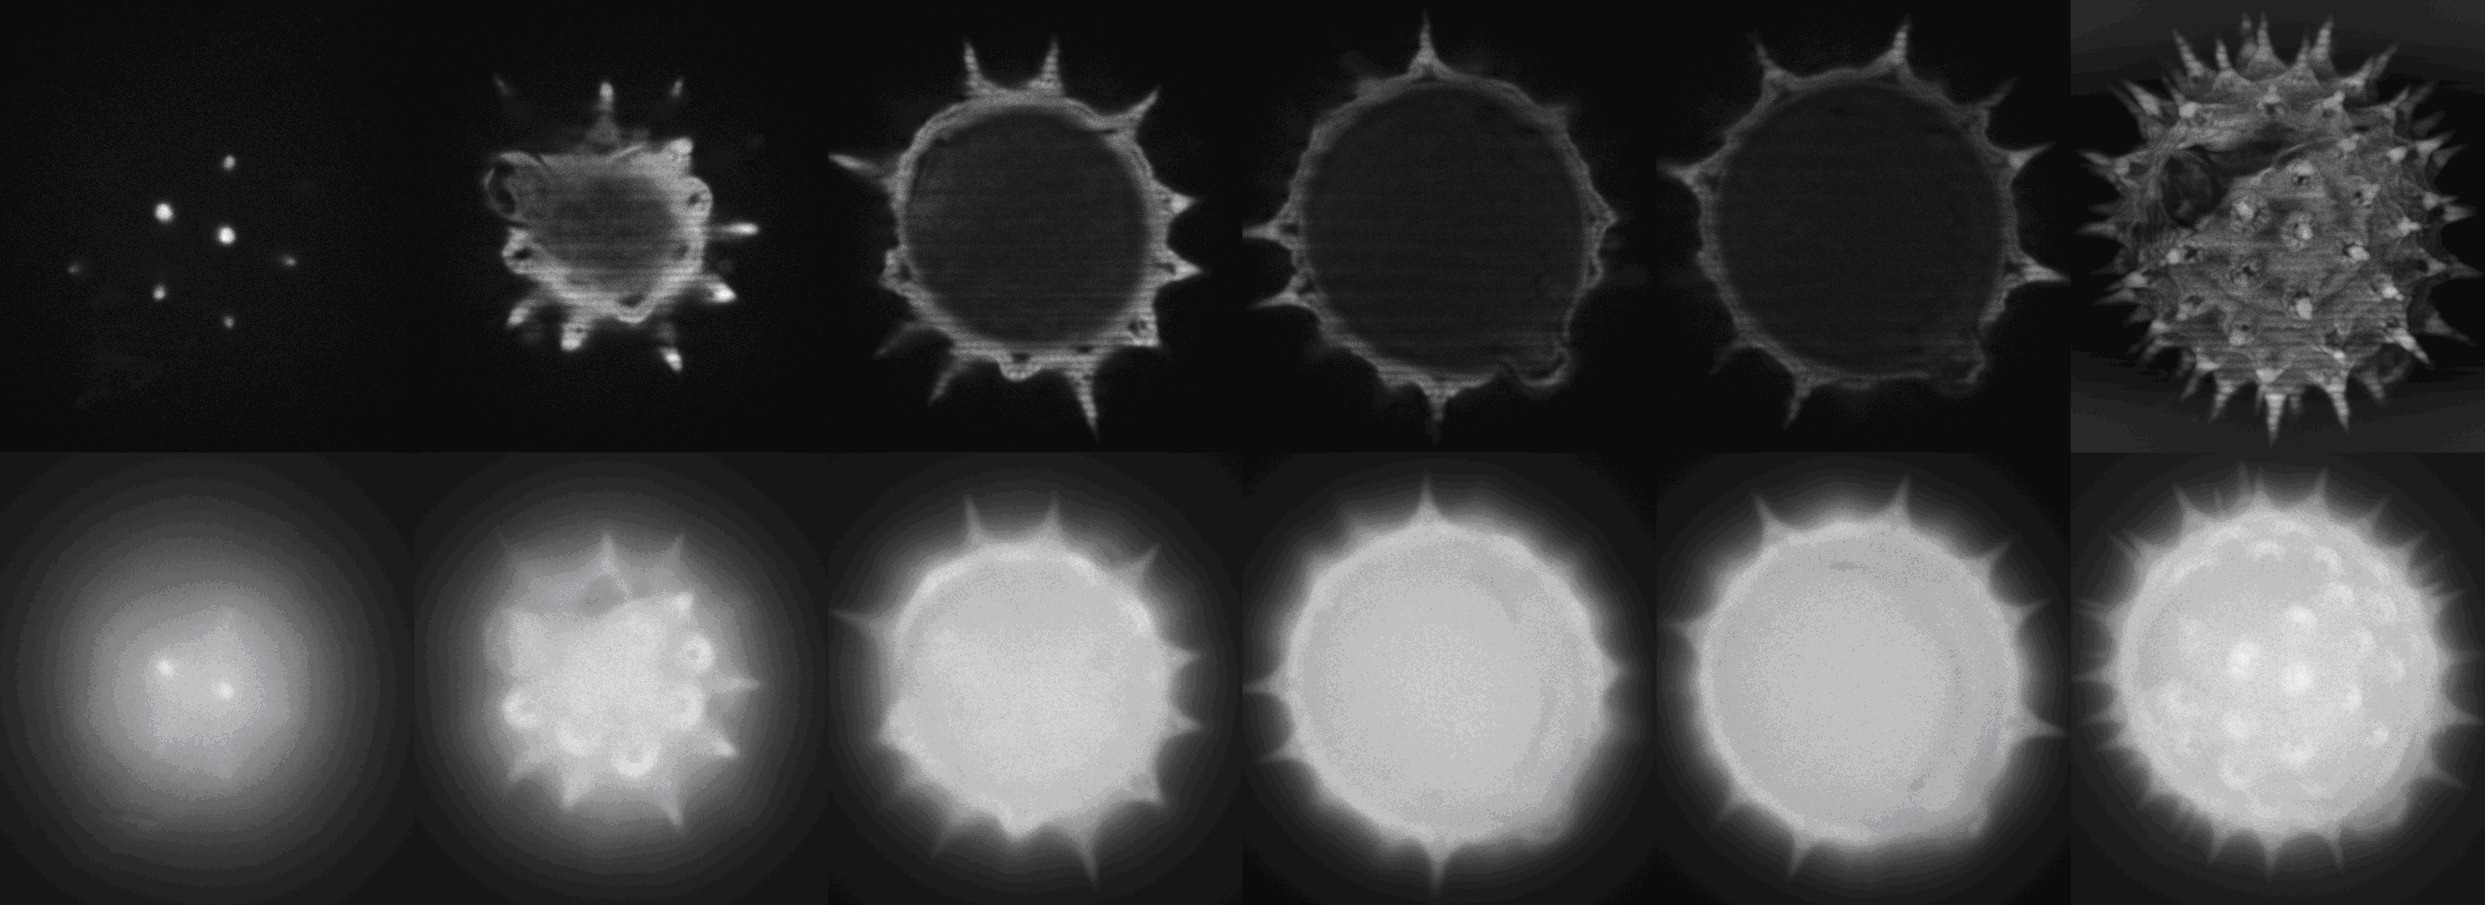
Demonstration of optical sectioning of a birch pollen grain.
Upper row: Optical sections acquired with structured illumination generated by a spatial light modulator in a PAM developed at ICBP.
Bottom row:
Images acquired by conventional light microscopy.
The right-most panels show maximum intensity projections.
The main advantage in using spatial light modulators is the increase in the speed of image acquisition, making live-cell imaging possible.
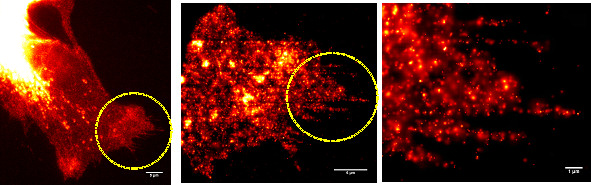
Superresolution acquired by PALM/STORM.
Left: Conventional fluorescence micrograph of an A431 cell expressing erbB3-mCitrine.
Scale bar: 5 um.
Middle: Superresolution image of an area indicated in the leftmost image by the yellow circle. Scale bar: 5 um.
Right: Enlargement
of the area indicated in the middle image by the yellow circle. Single molecules are localized with a precision of up to 20 nm. Scale bar: 1 um.
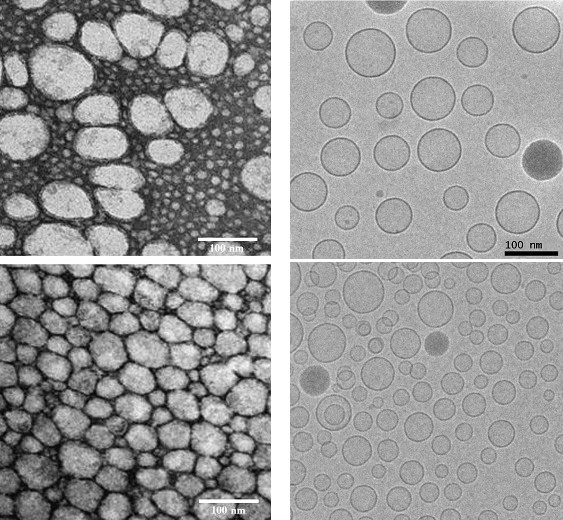
Electron microscopy images of silica-silicone nanocapsules prepared by template polymerization (Kepczynski et al., 2009, 2010).
Left panel: Conventional TEM images of negatively-stained cryosamples.
Right panel: Cryo-electron microscopy imaging of rapidly frozen samples. The capsules embedded in vitreous ice are imaged very close to their native state.
Each row contains images of identical samples. It is obvious that conventional TEM imaging does not enable imaging of the native state. Scale bar: 100 nm (bottom right image is on the same scale as the top right image).
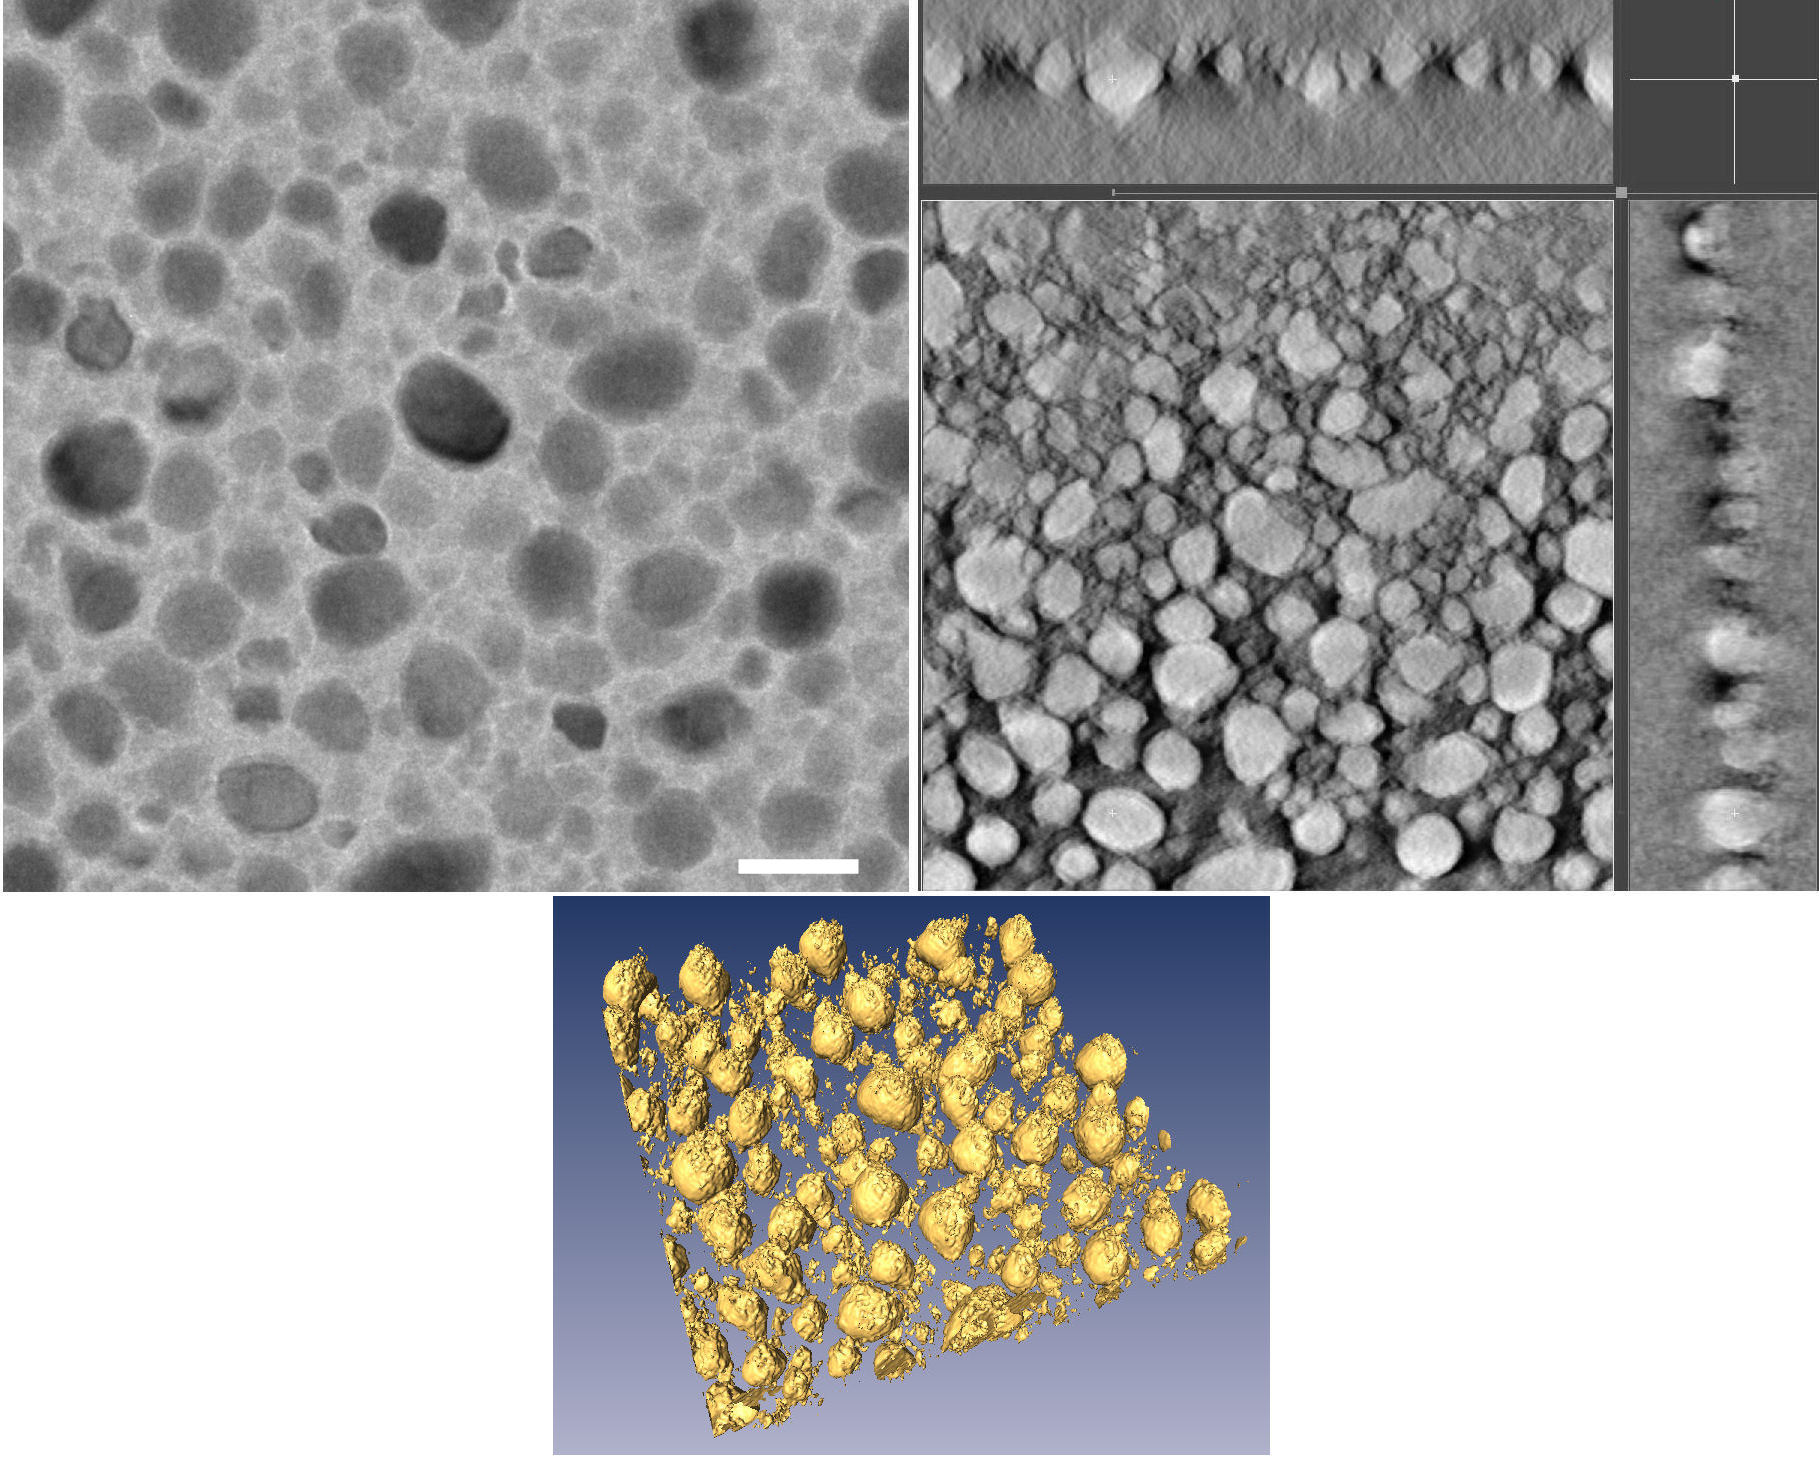
Electron tomography of thin Sn:hex nanocomposite layers. (Matoušek et al., 2009).
Left: Conventional TEM image acquired on a Tecnai Sphera 20 at an acceleration voltage of 200 kV. Magnification of 25000x. Scale bar: 50 nm.
Right: Three cross-sections perpendicular to each other taken from the tomographic reconstruction of 69 projections acquired in the tilting range ±70°. The cross-sections are shown with inverted
contrast.
Bottom: Three-dimensional rendering of the reconstructed image.
The thin layers were prepared by magnetron sputtering from a tin target in a mixed atmosphere of Ar and n-hexane.